Track your padel progress by logging every match. Record date, location, and final score each time you play. Note your first-serve percentage and double faults per match.
Track break points faced and converted using the formula: (breaks won ÷ break points faced) × 100. Aim for at least 40% break point conversion. Log aces and unforced errors weekly.
Review trends monthly to spot weaknesses. Use a mobile app or smartwatch to log points in real time. Continue to access detailed analytics.
Why Personal Match Data Elevates Your Padel Game
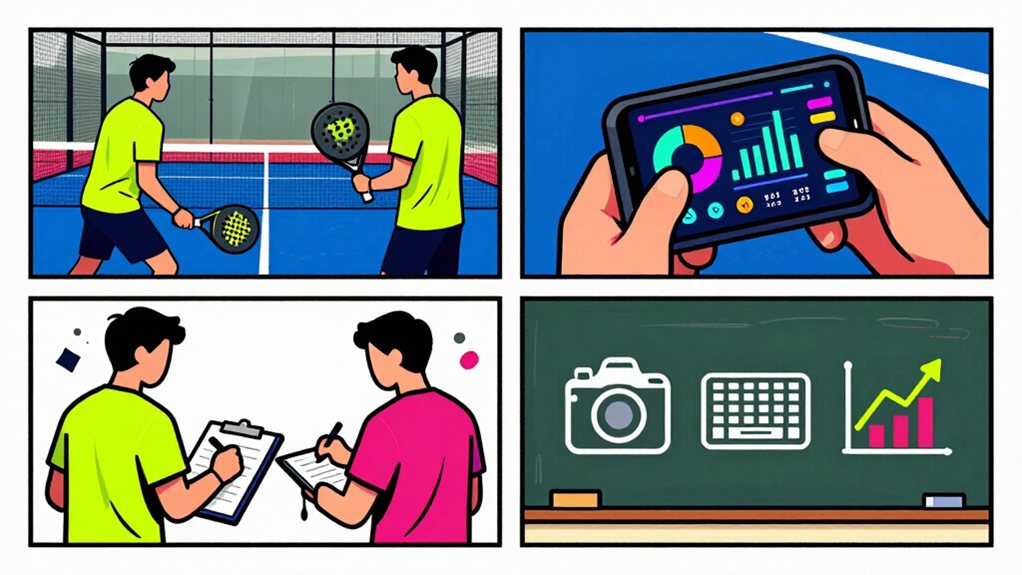
When you track your padel matches, you gain insights that transform how you practice and compete. You identify patterns that remain invisible without documentation.
Each match record creates a data point for analysis.
Why track your matches?
- You build a personal database that shows your true performance over time.
- You spot weaknesses in your game that need practice attention.
- You measure progress with real numbers instead of feelings.
- You prepare better for specific opponents by studying past encounters.
- You set measurable goals based on actual performance data.
You record crucial details including date, location, score, and partners. You capture the full context of each match. Just as smart thermostat technology helps you optimize your home environment by tracking patterns over time, tracking your match data helps you optimize your performance by revealing trends you would otherwise miss.
Start documenting today.
Your future self thanks you for the effort.
Which Padel Metrics Actually Improve Your Game?
Track serve efficiency and break point conversion to pinpoint exactly where you gain and lose points.
Your serve efficiency measures first serve percentage, second serve winners, and double faults per match.
Break point conversion shows how often you convert the opportunities you create against your opponent’s serve.
Serve Efficiency
Consistently improving your serve efficiency directly impacts your match results. Track the following metrics to identify gains and set targets:
- First-serve percentage, count first serves divided by total service points, multiply by 100.
- Second-serve win rate, count points won on second serve after delivery.
- Aces per match, record serve that lands untouched and scores a point.
- Double faults per set, log second serve that misses the box.
- Serve placement zones, note attempts in deep, middle areas; aim for 60% deep.
These values let you compare progress over time. Use your app; you’ll always log each serve clearly after every point.
Review weekly trends and adjust practice to raise first-serve accuracy and reduce double faults.
Break Point Conversion
Understanding your break point conversion rate reveals how effective you’re at converting scoring opportunities against serving opponents. You should log every break point opportunity during each set. For each point, note if you earned a break chance and if you converted it. Then calculate your conversion rate using this formula: (breaks won ÷ break points faced) × 100.
- Identify break point scores: 0-40, 15-40, 30-40, and deuce (40-40 with advantage).
- Mark each break point you receive. Write ‘B’ for break opportunity.
- After converting, write ‘W’ next to the ‘B’.
- At match end, count total Bs and total Ws. Apply formula above.
Target at least 40% conversion in matches. Below 30% signals need to improve return timing. Track each match.
How to Set Up Your Match Logging Workflow
First, create a match entry. Open the match creator tool, select the date, location, and playing category or level, then input the final score.
Next, record player details by registering your teammate and opponents in the player database before you log the match results.
Create Match Entry
When you’re ready to track your padel matches, you can create a new match entry in just a few steps.
- Open your tracking app and tap the “New Match” button.
- Select the date and time of your match.
- Enter the location where you played.
- Choose the category or skill level for the match.
- Input the final score for each set.
- Add any notes about the match conditions or notable events.
- Save your entry to complete the process.
Your app stores all match data in one place. You can edit entries later if you make mistakes.
Delete entries that were recorded in error.
This system replaces manual tracking methods and keeps your progress organized.
Record Player Details
Once you’ve created your match entry, recording player details builds your organized tracking database. Follow these steps:
- Open the player list for the match.
- Enter each player’s name, partner if doubles, and side left or right.
- Add a brief note about their role, such as serve specialist or baseline defender.
- Mark the result for each player: win, loss, or draw.
- Save the entry to confirm the data.
| Player | Position | Key Stat |
|---|---|---|
| Alex | Left side | 5 aces |
| Sam | Right side | 3 smashes |
| Jordan | Partner | 70% win rate |
| Casey | Opponent | 2 break points |
| Taylor | Opponent | 1 winner |
This data helps you recognize strengths, address weaknesses, and set goals.
Now your database captures each player’s contribution, enabling future analysis and personal improvement.
Reading Match Analytics to Identify Weak Spots
By examining your performance data, you can pinpoint specific areas that need improvement. Start by reviewing your point-level metrics.
By reviewing point-level metrics, you can pinpoint exact areas needing improvement.
Look at these key statistics:
- Break point conversion rate, count how many break points you win out of total attempts
- Unforced errors, track faults in baseline rallies, smashes, and volleys separately
- Winner-to-error ratio, compare clean winners against mistakes in each set
- Serve success percentage, measure first serves in versus double faults committed
- Return game performance, note returns made in play versus returns hit long or into net
Compare your stats against match results. Identify patterns where losses show higher error counts. Note which shot types produce most failures.
Focus practice sessions on your lowest-performing metrics. Your data reveals where your game needs work.
Visualizing Performance Trends Across Your Match History
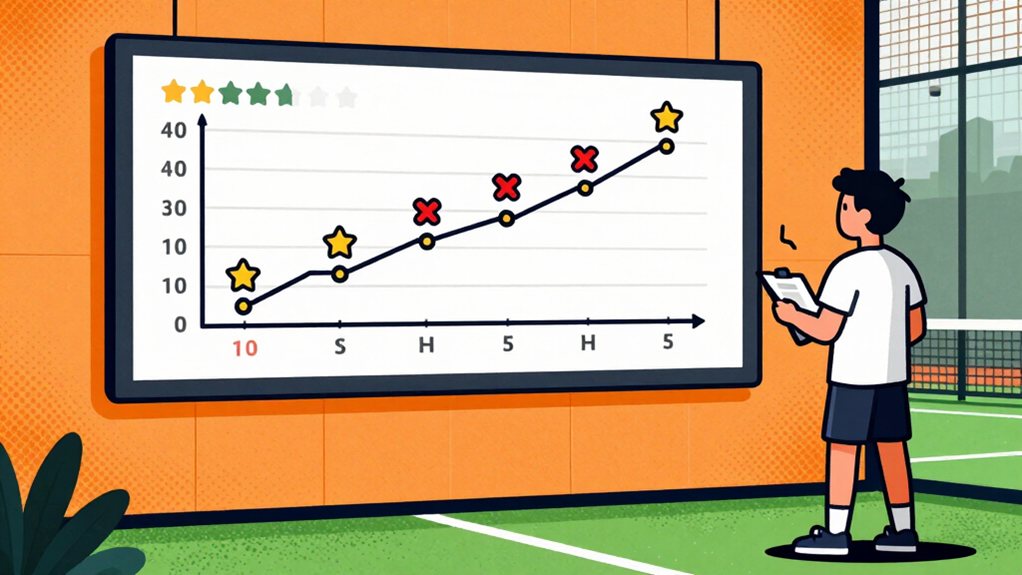
After you identify your weak spots, viewing your performance over time becomes the next logical step. We use timeline charts to track win rates, break point conversions, and streak lengths across weeks and months.
- Select the “Performance Timeline” option from your analytics dashboard
- Choose date ranges covering at least ten matches
- Review trend lines for upward or downward movement
The table below shows a sample three-month performance snapshot:
| Month | Win Rate | Avg Break Points Converted |
|---|---|---|
| Jan | 45% | 2.3 |
| Feb | 58% | 3.1 |
| Mar | 62% | 3.8 |
Green indicators signal improvement. Red markers highlight regression. You then adjust training focus based on these visual patterns.
Tracking Shot Types for Technical Precision
To improve your technical precision, tracking shot types provides detailed insight into your gameplay patterns. You must categorize each shot during your matches.
- Log smash winners separately from direct faults. This shows your attacking success rate.
- Record lob attempts and their outcomes. Note when opponents force errors.
- Track bandeja shots and volleys. Count how many you win versus lose.
- Document counterattack successes. Identify your defensive strengths.
You should review these categories weekly. Compare your percentages against previous matches.
Look for patterns in successful shots. Adjust practice sessions to target weak areas. Focus on shot placement over power.
Count your net approaches. Measure conversion rates for each shot type. Build a clear picture of your technical development.
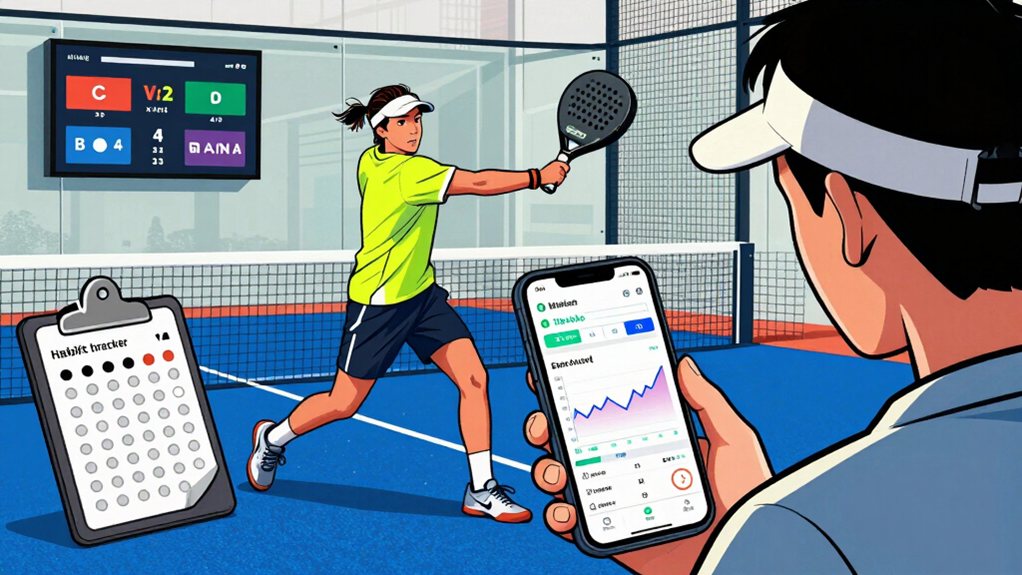
Using Mobile Apps and Wearables for Real-Time Data
When you integrate mobile technology into your match routine, you gain real-time data capture without interrupting your gameplay flow. Mobile apps sync automatically across your devices. Your match data stays current on your phone, tablet, and computer.
- Download the app from the App Store or Google Play.
- Create your player profile.
- Enable smartwatch connectivity in settings.
- Tap the match button before each game.
- Use your Apple Watch to log points with a single tap.
Wearable notifications display score updates on your wrist. You see server information, game count, and set progress without checking your phone.
Cross-platform sync keeps your stats accurate. Your historical data remains accessible anytime.
The app records timestamp, location, and match category automatically. You focus on playing while technology handles the documentation.
Connecting Heart Rate and Calories to Match Intensity
As you connect heart rate and calorie data to your match intensity, you gain insights that link physical effort to performance outcomes.
Heart rate monitors reveal your cardiovascular strain during points. Higher rates during extended rallies show your body works harder when rallies exceed 10 shots. Calorie tracking quantifies total energy expenditure.
A typical padel match burns 300-500 calories depending on match duration and your intensity level.
Your wearable records these metrics automatically. You don’t need manual entry during play.
- Sync your device after each match.
- Review heart rate zones for the entire match.
- Compare calorie burn across similar match durations.
Use this data to plan recovery nutrition. Higher heart rate matches demand more post-match attention. Higher calorie matches may require additional protein intake within 30 minutes post-match.
Building Lasting Padel Tracking Habits for Progress
Since you now understand how to track heart rate and calories, building consistent tracking habits becomes your next priority. You’ll set a reminder on your phone at 6 p.m. to log each match within 24 hours.
Record date, location, level, final score, and teammates.
Add short notes on shots you missed. Review past entries every week to spot trends.
Use the app’s badge system: earn a badge after 5, 10, and 20 logged matches. Combine wearable sync to capture heart rate and calories automatically.
Follow these steps:
- Open the app after each match.
- Tap “Add Match.”
- Fill required fields.
- Save and confirm.
Consistent logging builds reliable data, fuels progress, and helps you plan future training. Track daily to see your improvement clearly.
Frequently Asked Questions
Can I Export My Match Data to CSV?
You can export your match data through Power BI integration, which enables detailed ranking and win rate analysis. The platform provides customizable filtering by date range, result, or playing level for your exported data.
How Do I Delete a Previously Recorded Match?
You open your match history, find the match you want to remove, select the delete option, confirm your decision, and the system permanently erases it from your records.
Is My Personal Match Data Private and Secure?
While some assume free apps neglect privacy, your match data stays protected through advanced encryption, controlled access, and strict security measures, guaranteeing your personal information remains private and secure.
Can I Add Multiple Teammates to a Single Match Log?
Yes, you can add multiple teammates to a single match log. The built-in match creator tools let you register several teammates and opponents when logging each game, which helps build your player database efficiently.
Do I Need a Smartwatch to Track Heart Rate During Matches?
You don’t need a smartwatch to track heart rate. Chest straps, fitness bands, or other heart rate monitors can sync with the app and capture your cardiovascular data during matches, giving you valuable performance insights.
Final Thoughts
Track your padel progress with data you collect. Set a weekly target: log at least three matches, record shot types, and note heart rate zones. Use the app to review your win rate and rally length. Identify one weakness each week, then drill it for 15 minutes.
Remember, a stitch in time saves nine. Stay consistent, and we’ll see improvement. 1. Log each match. 2. Record heart rate zones. 3. Review stats weekly now today.